




The headline from the midyear store data reads like a recovery. Coresight Research tracked 3,321 US store closures in the first half of 2026, actual and planned — a 44.1% drop from the 5,941 it counted at the same point in 2025. Retailer bankruptcies fell from 32 at midyear 2025 to 10. For anyone who spent the last three years reading closure trackers, that is a genuine change of weather.
The second number is the one that matters more for anybody who has to put people in those stores. Openings fell too: 3,215 in the first half, down 23% year on year. Coresight’s central full-year estimate is roughly 6,428 closures against 4,482 openings, declines of 30.1% and 19.3% respectively.
So the fleet is not recovering in the sense of getting bigger. It is settling — fewer doors shutting, fewer doors opening, and underneath both, a steady re-sorting of which kinds of stores exist.
Stabilising is not the same as static
A net figure flatters what is actually happening. If a brand loses forty apparel doors and gains thirty-five discount-format doors, the store count barely moves and almost every operational assumption behind the coverage plan does.
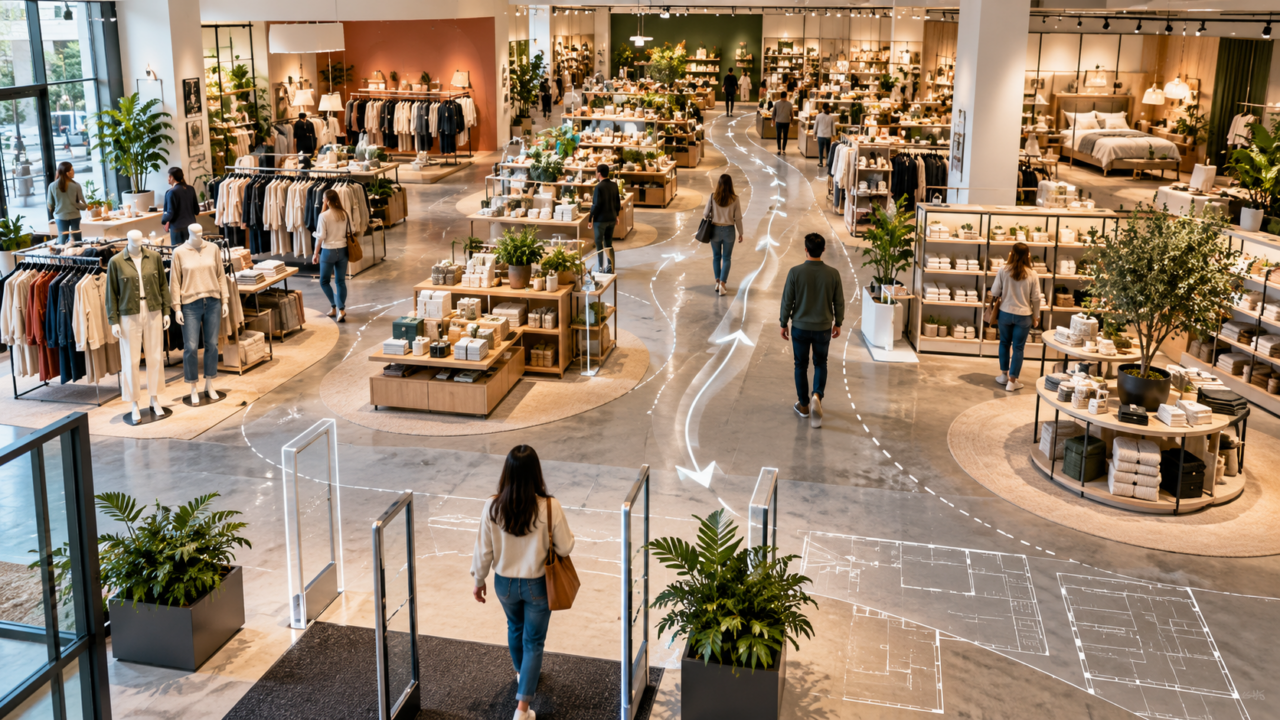
Apparel led all closures in the first half of 2026, with 1,090 — 32.8% of the total. The composition of the closure list has shifted too: the 2025 wave was driven by large-format department stores and big-box retailers, while the rationalising now is being done more by smaller specialty and discretionary retailers. Meanwhile value-focused chains and off-price retailers continue to add locations, with Dollar General alone reported at 442 planned openings.
That is not a shrinking market. It is a market trading one kind of square footage for another.
Why the banner mix changes the cost of coverage
Field coverage is usually budgeted as a number of visits at an average cost per visit. That average is an artefact of the estate it was calculated on, and it moves when the estate changes shape.
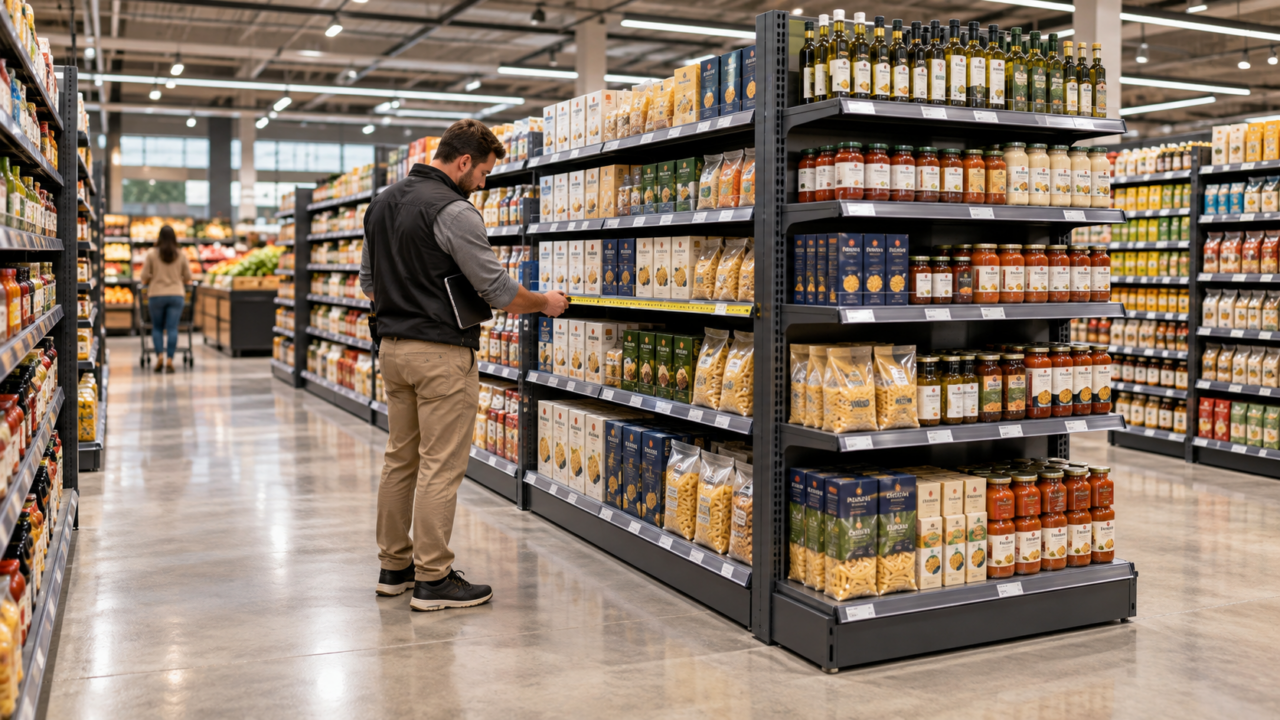
A large-format store and a small-format value store are different units of work in ways that compound. Visit duration differs, because the section is a different size and the SKU count behind it is different. Planogram format differs, and a crew that knows one banner’s packet format works faster than one meeting it for the first time. Receiving and back-room processes differ, which decides whether product for a set is findable in ten minutes or forty. Access rules differ — who may work the floor, during which hours, with what notice. And store density differs, which is the quiet one: value formats tend to be more numerous and closer together, which can actually reduce travel cost per visit even as the visit count rises.
None of that shows up in a door count. All of it shows up in whether a scheduled visit gets completed on the first attempt.
The plan that is quietly wrong
Most annual field plans are renewed by taking last year’s store list, adjusting for known closures, and applying the same visit frequency and rate. It is the obvious way to do it, and it carries a specific failure: it assumes the stores that replaced the closed ones behave like the ones that left.
In a year when a third of closures are apparel and much of the opening activity is value formats, that assumption breaks quietly. The symptoms arrive later as an unexplained drop in first-visit completion, crews running over their scheduled hours in specific banners, and a compliance score that sags in one region without an obvious cause.
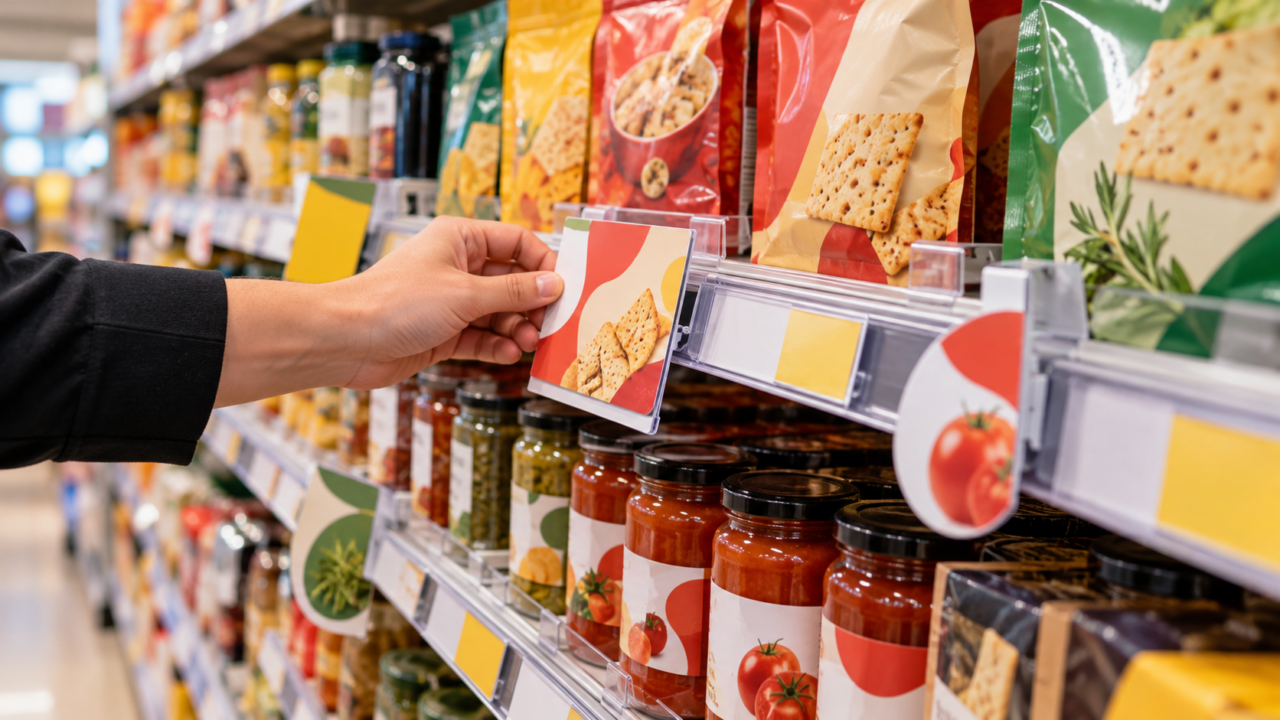
The fix is unglamorous: re-score the store list before the coverage numbers are locked. Group doors by banner and format rather than by geography alone, attach a realistic visit duration to each group based on what crews actually record, and let the frequency follow the value of the door rather than the convenience of a round number. Retail execution discipline is mostly this: making the plan match the estate you have rather than the one you had.
The second-half overhang
The midyear improvement carries a caveat that the same coverage makes explicit. Analysts expect the second half of 2026 to be harder, with tariff-related costs, cautious consumer spending and financial pressure on smaller retailers all pointing the same way. UBS has estimated that sustained tariffs could reduce retail sales by roughly 0.5% annually, with retailers absorbing something in the order of $100 billion in increased costs.
For execution planning, the useful reading of that is not to forecast the closure number. It is to expect the store list to keep moving inside the year rather than settling at renewal, and to contract coverage in a way that can absorb it — scope that can be re-weighted mid-term, rather than a fixed schedule agreed in January against a list that will be wrong by April.
What to audit before the next planning cycle
Five things are worth checking while there is still time to change the plan rather than explain it.
Which of your doors are in banners that closed stores this year, and what your exposure is if that continues. Which new doors have entered the estate through banner expansion, and whether anyone has walked one to see what the work actually involves. Whether your recorded visit durations differ materially by banner — they usually do, and the average hides it. Whether your coverage frequency reflects door value or just inherited habit. And whether the contract lets you move visits between stores mid-term without renegotiating.
That last one is the difference between a plan that survives a moving store list and one that has to be re-cut every time the list moves. In a year where the fleet is re-sorting rather than simply shrinking, it is the clause worth arguing over.
Talk to our team about re-scoring coverage across a changing footprint, or see how retail management services and store reset services are usually structured around it.
Frequently Asked Questions
How many stores are closing in the US in 2026?
Coresight Research tracked 3,321 closures, actual and planned, in the first half of 2026 — down 44.1% from the 5,941 at the same point in 2025. Its central estimate for the full year is around 6,428 closures, a decline of roughly 30% against 2025.
Are store openings increasing in 2026?
No. Openings fell as well. Coresight tracked 3,215 openings in the first half of 2026, down about 23% year on year, with a central full-year estimate near 4,482 — a decline of roughly 19% on 2025. Closures and openings are both slowing, which stabilises the fleet rather than growing it.
Which retail sectors are closing the most stores?
Apparel led the first half of 2026 with 1,090 closures, 32.8% of the total. The profile has shifted from 2025, when large-format department stores and big-box retailers drove the wave; smaller specialty and discretionary retailers are doing more of the rationalising now, while value and off-price formats continue to add locations.
Why did store closures slow in 2026?
Principally because fewer retailers went bankrupt. Coresight counted 10 retailer bankruptcies at midyear 2026 against 32 a year earlier, and bankruptcy-driven liquidations are what produce large blocks of closures at once.
How do store closures affect a brand’s field coverage plan?
More than the net door count suggests. When closures concentrate in one format and openings in another, the same number of doors requires a different amount of work: visit durations, planogram formats, receiving processes, access rules and store density all vary by banner. A plan renewed against last year’s list and last year’s average cost per visit will under-resource the banners that grew.
What effect are tariffs having on store counts?
Indirectly, through cost pressure. Analysts expect tariff-related costs, cautious consumer spending and pressure on smaller retailers to make the second half of 2026 harder than the first. UBS has estimated that sustained tariffs could reduce retail sales by roughly 0.5% a year, with retailers absorbing on the order of $100 billion in increased costs.
How often should a store coverage list be reviewed?
At least at every planning cycle, and realistically more often in a year when the estate is turning over. The practical test is whether the contract permits visits to be moved between stores mid-term. If it does not, the list has to be right at signature, which it rarely is.
What should be measured to detect a coverage plan that no longer fits?
First-visit completion rate broken out by banner rather than nationally, recorded visit duration against planned duration, and compliance scores segmented by format. A plan that has drifted out of alignment with the estate usually shows up first as crews running over scheduled hours in specific banners, well before it shows up in sales.
T-ROC Editorial Team
The T-ROC editorial team brings 20+ years of retail industry expertise across brand ambassador programs, mystery shopping, retail merchandising, and managed technology solutions. Learn more about T-ROC.