





Search for retail KPIs and you will find lists of twenty-five metrics: sales per square foot, gross margin return on investment, average transaction value, conversion rate, inventory turnover. All real, all worth knowing, and almost none of them something a person can change on a Tuesday.
That is the problem with most KPI lists. They measure outcomes, and outcomes are the sum of decisions already made — assortment, pricing, location, marketing. If you run stores or a field program, you need the smaller set of numbers that sit upstream: the ones a store visit moves this week, which then move the outcomes next quarter.
Two kinds of retail KPI
Outcome KPIs tell you how the business performed. Sales per square foot, comparable store sales, margin, turnover. They belong in the board pack. They are also slow, aggregated, and influenced by so many variables that attributing a change to any single action is guesswork.
Execution KPIs tell you whether the plan actually happened in the store. Was the planogram built. Is the product on the shelf. Does the price on the tag match the till. They are fast, specific, and every one of them has a named owner and a defined corrective action.
The relationship runs one way. Execution KPIs move outcome KPIs. Watching the outcome without the execution number leaves you knowing that something went wrong, without knowing what.
The execution KPIs worth tracking
1. Planogram compliance rate
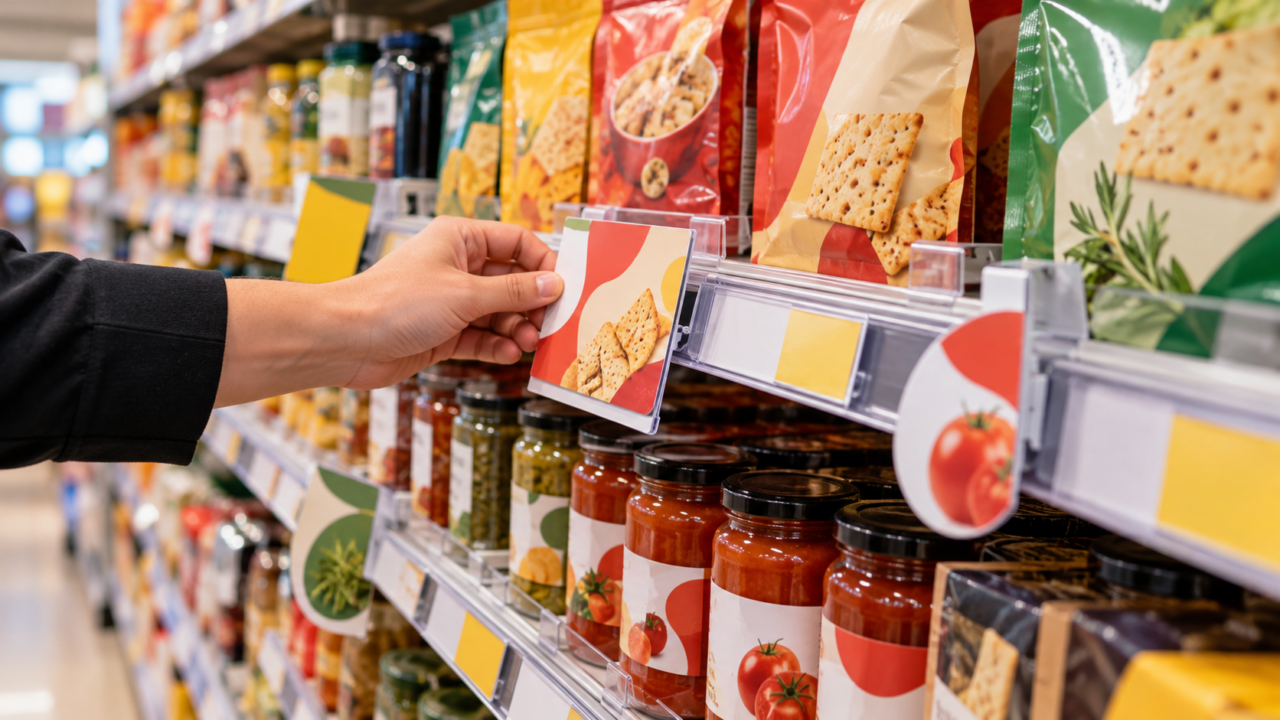
The percentage of audited stores where the section matches the approved layout — right products, right positions, right facings. It is the base measurement of whether your merchandising plan exists outside the document. What moves it: reset execution quality, photo verification and a fix-on-visit standard.
2. On-shelf availability
The share of visits where a priority SKU was physically present and reachable. Note the wording: reachable, not “in stock according to the system”. The gap between those two is phantom inventory, and it is invisible in every report that trusts the inventory record.
3. Price integrity rate
The percentage of checked items where shelf tag, promotional signage and POS agree. Check promotional prices separately from everyday prices — temporary changes fail far more often, because they require an action at both the start and the end of the window.
4. Display build rate
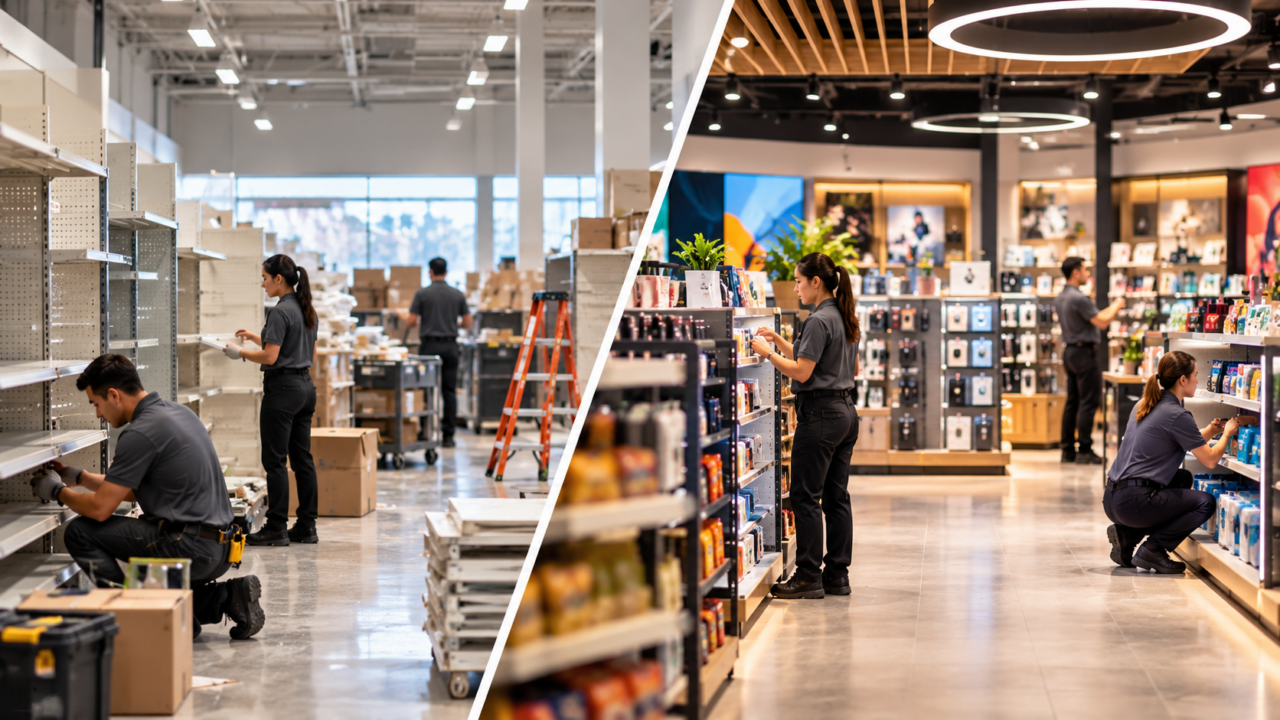
Of the stores authorised for a secondary display, how many physically had it, on time, with the correct product. This is the number that separates a promotion that underperformed from one that was never executed — covered in more depth in our guide to endcap displays.
5. Speed to fix
The median time between a problem being identified and resolved. Most programs measure how many issues were found and never measure this one, which is where the cost actually accumulates. A finding that waits three weeks for the next scheduled visit carries three weeks of loss.
6. Share of shelf
Your facings as a percentage of the category, measured in the store rather than agreed in the annual negotiation. Drift here is gradual and rarely reported: nobody announces that a competitor gained two facings during a reset.
7. Visit completion and coverage
Whether the stores that were supposed to be visited were visited, at the planned frequency. Unglamorous, and the first thing to check when the other numbers look inexplicably flat.
8. Revenue per visit
Incremental category revenue divided by the number of field visits that produced it. This is the number that justifies the program budget, and the one most likely to be missing when the budget is questioned.
The chain-average trap
Every one of these numbers is misleading as a single national figure. A chain average of 82% planogram compliance can be 95% in most stores and 40% in a specific banner, and those two situations require completely different responses.
Track by store and by banner. The distribution is the finding; the average is what hides it. This is the same measurement discipline behind measuring retail execution ROI: aggregate numbers confound the program with everything else happening in the market.
How often to measure
Cadence should follow store value rather than convenience. A uniform national schedule overserves the stores that do not need it and underserves the ones paying for the program.
- Weekly or biweekly for high-revenue and high-variance locations, and for any store in the middle of a launch or promotional window.
- Monthly for the core of the footprint, which is enough to catch drift before it compounds.
- Quarterly for stable, lower-volume stores where the cost of the visit exceeds the value of the finding.
What matters more than the interval is that it is the same interval, measured the same way. A number that moved because the method changed has not moved.
Start with five, not thirty
A KPI set that nobody can recite is a reporting exercise. Most programs are better served by four or five numbers that everyone knows, with a named owner and a defined corrective action for each, than by a dashboard that covers everything and changes nothing.
A reasonable starting set for a brand selling through retail: planogram compliance, on-shelf availability, price integrity, display build rate and speed to fix. Establish the baseline across a representative sample before changing anything — you cannot show improvement without knowing where you started. From there, the operational discipline is the one described in retail operations: measure, rank stores by impact, fix, re-measure the same way.
Each of these depends on somebody standing in the aisle and recording what they see, which is why KPI programs and retail audit programs tend to be the same programme under two names.
Frequently Asked Questions
What are retail KPIs?
Retail KPIs are the measurements used to judge how a store, a chain or a retail program is performing. They divide into outcome KPIs such as sales per square foot and margin, which describe results, and execution KPIs such as planogram compliance and on-shelf availability, which describe whether the plan was carried out in the store.
What is the difference between a KPI and a metric in retail?
A metric is anything you can count. A KPI is a metric you have decided to manage against, with a target, an owner and a consequence when it moves. Most retail dashboards contain many metrics and few genuine KPIs.
How many KPIs should a retail program track?
Four or five that everyone can name, rather than thirty nobody reviews. Each should have a named owner and a defined corrective action. Additional metrics can be reported without being managed as KPIs.
What is a good planogram compliance rate?
Use your own measured baseline rather than an industry benchmark. Compliance varies widely by category, banner and reset cadence, and the number that matters is whether yours is improving in the stores where the revenue is. Chain averages hide the stores that need attention.
Which retail KPIs can a field team actually change?
Execution KPIs: planogram compliance, on-shelf availability, price integrity, display build rate, share of shelf and speed to fix. Outcome KPIs such as margin or sales per square foot move as a consequence, but no single store visit changes them directly.