


Shopper Insights: The Complete Guide to Understanding Your Retail Customer (2026)
\n\n
A major consumer electronics brand once spent six months building a planogram based on focus group feedback. Shoppers said they wanted products organized by use case. The brand believed them. Conversion dropped 14% within 90 days of the reset.
\n\n
The problem wasn’t the data. It was the source. What shoppers say in a controlled environment and what they do when standing in a crowded aisle on a Tuesday afternoon are two different things. The gap between stated preference and actual behavior is where retail revenue is lost—and where shopper insights live.
\n\n
This guide covers what shopper insights are, why most brands are sitting on an underused asset, how to capture them systematically, and what the data from 2026 tells us about where retail customers are heading.
\n\n \n
What Are Shopper Insights?
\n \n\n
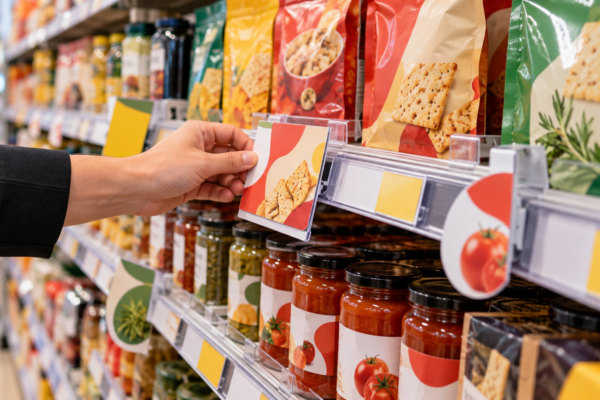
Shopper insights are behavioral data and analysis collected at or near the point of purchase. They answer a specific set of questions: How does a person move through a store? What causes them to stop? What triggers a pick-up? What triggers a put-down? What causes a walk-away?
\n\n
The term is precise. A shopper is a person in a buying context—physically or digitally navigating a retail environment with some intent to purchase. A consumer is a person who uses a product. The distinction matters because the decision-making processes are different, the environments are different, and therefore the data collection methods need to be different.
\n\n
Shopper insights draw from multiple inputs: structured observation, mystery shopping programs, transactional data, heat mapping, intercept surveys, and in-store associate feedback. When those inputs are combined and analyzed, they produce a picture of what’s actually happening on the floor—not what anyone assumed would happen.
\n\n
T-ROC’s Consumer Insight division, recognized as an MSPA Americas Elite 2022 company, specializes in exactly this: structured research programs that capture real shopper behavior across retail environments and turn it into actionable strategy.
\n\n
Shopper Insights vs. Consumer Insights: A Quick Distinction
\n\n
Consumer insights ask: What do people want? Why do they prefer one brand over another? What emotional need does this product meet?
\n\n
Shopper insights ask: What did they actually do? Where did they look? How long did they spend? What did they pick up and then put back?
\n\n
Both are necessary. Neither replaces the other. But for teams making decisions about in-store execution—planogram resets, staffing levels, promotional placement, endcap strategy—shopper insights are the more actionable input. We cover the full distinction in depth in our article on shopper insights vs consumer insights.
\n\n \n
Why Shopper Data Is Your Most Underused Asset
\n \n\n
Most retail organizations collect more data than they analyze. POS systems generate thousands of SKU-level transactions daily. Loyalty programs track purchase frequency and basket composition. Foot traffic counters log entry and exit. Online behavior is captured in near-real-time.
\n\n
And yet a significant portion of in-store decisions still get made on gut feel, historical precedent, or vendor recommendations that are not disinterested.
\n\n
The gap is not a data collection problem. It is an analysis and activation problem. The data exists. What most organizations lack is the structured methodology to turn that data into decisions—specifically, decisions at the SKU, department, store, or associate level.
\n\n
Understanding how customer data insights help a retail company requires looking beyond the spreadsheet. The brands that extract the most value from their shopper data share three characteristics:
\n\n
- \n
- They define the question before they collect the data. Research programs built around a specific business hypothesis generate more useful outputs than general data sweeps.
- They combine behavioral and attitudinal inputs. Transaction data tells you what happened. Observational research tells you why. Mystery shopping tells you what the experience felt like. Each layer adds explanatory power.
- They close the loop at store level. Insight without execution is analysis theater. The brands that win translate findings into specific operational changes—and then measure the effect.
\n
\n
\n
\n\n
The underused asset is not the raw data. It is the discipline to ask a clean question, collect the right evidence, and act on the answer.
\n\n \n
Shopper Insights vs. Consumer Insights: Key Differences
\n \n\n
The distinction between shoppers vs consumers shapes every research decision downstream. Getting it wrong means collecting data that cannot answer the question you’re actually trying to answer.
\n\n
| Dimension | Shopper Insights | Consumer Insights |
|---|---|---|
| Context | Point of purchase, in-store or digital shelf | At home, at work, during use |
| Core question | What did they do and what drove the decision? | What do they want and why do they want it? |
| Primary methods | Observation, mystery shopping, intercept, transaction data | Surveys, focus groups, ethnography, brand tracking |
| Output | In-store execution recommendations | Brand and product strategy recommendations |
| Decision owner | Retail ops, category management, field teams | Brand marketing, product development, CMO |
| Time horizon | Short-to-medium term (90 days to 12 months) | Medium-to-long term (12 months to 3 years) |
\n\n
The practical implication: a brand that only conducts consumer research will develop accurate brand strategy and consistently poor in-store execution. A brand that only conducts shopper research will optimize execution in a vacuum, without understanding the underlying motivations that drive category choice.
\n\n
The strongest retail programs integrate both. They understand what draws a customer to a category and what converts them at shelf.
\n\n \n
The 6 Methods for Capturing Shopper Insights
\n \n\n
Not all research methods produce the same kind of data. Each has a specific application, a specific cost structure, and a specific set of questions it can and cannot answer. Choosing the wrong method for the question is one of the most common research mistakes in retail.
\n\n
1. Mystery Shopping
\n\n
Mystery shopping deploys trained evaluators as anonymous shoppers to assess a defined set of criteria: associate engagement, product knowledge, planogram compliance, pricing accuracy, promotional execution. The output is structured, scored, and comparable across locations and time periods.
\n\n
The method is particularly strong for assessing service quality against a defined standard. It tells you what a shopper experienced—not what they said they experienced in a post-visit survey, which is subject to recall bias and social desirability effects.
\n\n
T-ROC’s Consumer Insight division conducts mystery shopping programs across national retail environments, producing data that brands use to identify training gaps, compliance failures, and experience inconsistencies across store networks.
\n\n
2. Observational Research
\n\n
Trained observers watch shoppers—with consent—as they navigate a defined area of the store. They record dwell time, path patterns, product interaction, and conversion behavior without intervening. The result is behavioral data uncorrupted by the act of asking questions.
\n\n
This is the method that catches the gap between stated preference and actual behavior. Shoppers who say they always compare prices rarely stop long enough to do so. Observational research makes that visible.
\n\n
3. Intercept Surveys
\n\n
Post-purchase intercepts capture the shopper’s stated rationale immediately after the decision, minimizing recall degradation. They are best used to add attitudinal context to behavioral observations—not as a standalone research method.
\n\n
Intercepts answer: what did the shopper think was happening? Observation answers: what actually happened? Both inputs are required for a complete picture.
\n\n
4. Transaction and Loyalty Data Analysis
\n\n
POS and loyalty data provides the largest sample size and the longest time series of any shopper research method. It captures what was bought, when, at what price, alongside what else was in the basket. Its limitation is that it explains outcomes without explaining cause.
\n\n
Transaction data can tell you that a category’s conversion rate fell 8% in Q3. It cannot tell you whether that fall was caused by a planogram reset, a competitor’s promotional activity, a staffing change, or a product quality issue. That explanation requires additional research layers.
\n\n
5. Heat Mapping and Foot Traffic Analytics
\n\n
Camera and sensor-based systems generate spatial data on shopper movement: which areas receive the most dwell, which are passed through without engagement, which have high foot traffic but low conversion. This data is especially valuable for layout decisions and department positioning.
\n\n
The technology has become significantly more accessible and accurate over the past three years. Retailers who have not yet applied it to their highest-revenue departments are leaving interpretive data on the table.
\n\n
6. Associate Feedback Programs
\n\n
Structured input from store associates is systematically undervalued in formal research programs. Associates observe shopper behavior across hundreds of interactions per week. They hear the questions, the objections, the comparisons, and the complaints that never reach a survey or a review platform.
\n\n
Formalizing associate feedback—through structured reporting tools, regular debrief cadences, or integrated observation frameworks—adds a qualitative layer that quantitative methods cannot replicate. The brands that do this well have a significant intelligence advantage over those that don’t.
\n\n \n
Consumer Spending Trends in 2026: What the Data Shows
\n \n\n
Understanding shopper behavior in isolation is not enough. Behavioral patterns are shaped by macro conditions: economic pressure, channel shift, category growth, and generational change. The consumer spending trends of 2026 are reshaping which categories are growing, which channels are gaining, and what shoppers are prioritizing when budgets are under pressure.
\n\n
Value Perception Is Not the Same as Price Sensitivity
\n\n
Retailers and brands that treat these as synonymous consistently misread the market. Shoppers who are under financial pressure do not simply buy the cheapest option. They buy the option they perceive as delivering the best outcome for the price paid. Private label growth in some categories reflects this logic. So does the continued strength of premium products in categories where outcome certainty matters—health, pet care, infant nutrition.
\n\n
The insight implication: research programs that only track price sensitivity miss the more important variable, which is value perception. How does the shopper assess quality, reliability, and outcome at shelf? That is the question that drives category strategy.
\n\n
Channel Fluidity Has Reached Maturity
\n\n
The question of online versus in-store has largely resolved itself into a question of occasion and category. Most shoppers now move across channels within a single purchase journey. They research online, buy in-store, return via a third option, and repurchase via subscription.
\n\n
The omnichannel and hybrid retail models that were experimental five years ago are now baseline expectation. Research programs that treat channels as separate environments will produce insights that are already outdated by the time they are acted on. The unit of analysis is the shopper’s total journey, not a single touchpoint.
\n\n
Experiential Expectations Are Rising in Physical Retail
\n\n
As commodity purchasing migrates online, the cases for physical retail are narrowing to two: convenience (fast, local, frictionless) and experience (discovery, expertise, engagement). The middle ground—standard-assortment stores with average service and no differentiating experience—is being compressed from both sides.
\n\n
Brands and retailers investing in associate expertise, interactive product engagement, and genuine service differentiation are capturing a shopper segment that is explicitly seeking those qualities. Shopper insight research that tracks experience quality alongside conversion data will identify which investments are producing measurable lift.
\n\n \n
The Dark Side of Personalization: Why More Data Isn’t Always Better
\n \n\n
The retail data industry has a volume problem. More data collection capability exists now than at any point in retail history. And yet the correlation between data volume and decision quality is weak. More data frequently produces more confusion, more latency in decision-making, and more surface area for analysis paralysis.
\n\n
The dark side of personalization in retail is worth examining carefully, because the risks are real and the industry has been slow to acknowledge them.
\n\n
When Personalization Backfires
\n\n
Hyper-personalization at scale requires assumptions about what a shopper wants based on their past behavior. The problem is that past behavior is an imperfect predictor of future behavior—particularly during life transitions, category trials, and economic pressure points. A loyalty algorithm that confidently serves the same offer to a shopper whose circumstances have changed is not personalizing. It is misfiring loudly.
\n\n
The brands that handle this best maintain a meaningful unknown segment in their research designs. They continue to ask questions of their existing customers rather than assuming the data already answers everything. That discipline is what keeps personalization programs calibrated to current reality rather than a historical picture.
\n\n
Privacy Expectations Are a Competitive Variable
\n\n
Shoppers are increasingly aware of how their data is collected and used. Research consistently shows that transparency about data practices improves trust and willingness to share—while opacity or perceived manipulation degrades it. Brands that treat data collection as a passive, invisible process are accumulating a trust debt that eventually becomes visible in churn rates and brand sentiment.
\n\n
The insight here is not anti-data. It is pro-consent and pro-transparency. Research programs designed with clear value exchange—where shoppers understand what they’re sharing and receive something of value in return—consistently produce higher quality data than passive surveillance systems.
\n\n \n
Using Shopper Insights to Drive Merchandising and Staffing Decisions
\n \n\n
Shopper insights are only as valuable as the decisions they inform. The most common failure mode in retail research is producing strong analysis that does not translate into operational change. The connection between insight and execution is not automatic. It requires deliberate process design.
\n\n
Merchandising Applications
\n\n
Planogram decisions should be driven by behavioral data, not by category captain recommendations alone. Vendor-recommended planograms optimize for the vendor’s product. Shopper-behavior-driven planograms optimize for the shopper’s experience—which tends to optimize for total category conversion, not individual SKU performance.
\n\n
The specific inputs that improve planogram decisions include: adjacency data (what are shoppers buying together?), dwell and interaction data (where do shoppers spend the most time and engagement?), and conversion data mapped to fixture position (do end-caps at this location convert or just draw traffic?).
\n\n
Understanding the hidden truth of retail pricing is equally important here. Price architecture at shelf—how high, mid, and low price points are positioned relative to each other—shapes value perception in ways that pricing decisions made in isolation cannot predict. Observational data on how shoppers navigate price architecture at shelf is one of the highest-value inputs for category management teams.
\n\n
Staffing Applications
\n\n
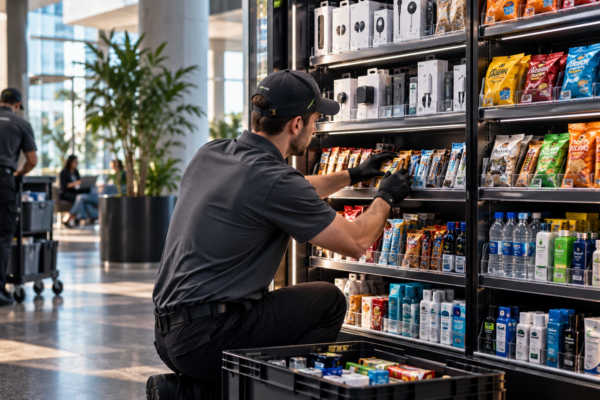
Mystery shopping and observational data produce two actionable staffing outputs: where coverage gaps are creating conversion losses, and where associate behaviors—positive or negative—are affecting shopper outcomes.
\n\n
Coverage gaps are straightforward: if observational data shows that shoppers in a specific department consistently look for assistance and leave without finding it, that is a staffing decision, not a marketing decision. The fix is operational.
\n\n
Behavioral coaching is more nuanced. Mystery shopping programs that score associate interactions against a defined standard identify specific behaviors—greeting, product knowledge, close technique, upsell execution—that correlate with conversion outcomes. That data produces targeted training inputs rather than general improvement mandates.
\n\n \n
Pet Care, Health Tech, and Emerging Category Insights
\n \n\n
Category-level shopper behavior varies significantly. The decision process in a high-stakes health category is different from the decision process in an impulse snack category. Research programs that apply a single methodology across all categories will produce accurate data in some categories and misleading data in others.
\n\n
Pet Care: The $147 Billion Behavioral Shift
\n\n
Pet care is one of the most analytically interesting categories in retail. The pet care $147 billion market is being driven by a behavioral shift that shopper research has documented clearly: pet owners are applying human health standards to pet product decisions.
\n\n
This has significant implications for shelf navigation, associate expertise requirements, and the type of information that converts at shelf. Shoppers in the pet health and nutrition category exhibit dwell patterns more similar to the human pharmacy aisle than to traditional pet food. They read labels. They compare ingredients. They seek expert guidance.
\n\n
Retailers and brands that treat pet care as a convenience-replenishment category will consistently underperform those that treat it as a considered-purchase category with appropriate associate training and shelf information architecture to match.
\n\n
Health Technology: High Consideration, Low Conversion Without Support
\n\n
Wearables, at-home diagnostics, connected health devices, and wellness technology share a common research challenge: the product’s value proposition is invisible on the shelf. The box communicates features. The shopper needs to understand outcomes.
\n\n
Observational data in health tech categories consistently shows high pick-up rates and high put-down rates—a pattern that signals product interest without sufficient information or confidence to convert. The conversion lever is almost always associate expertise or in-store demonstration, not shelf marketing.
\n\n
Research programs that track the ratio of pick-ups to conversions, and the rate of associate engagement relative to conversion, produce clear direction for both staffing investment and in-store experience design.
\n\n
Emerging Categories: Where Research Infrastructure Doesn’t Exist Yet
\n\n
Every two to three years, a category scales fast enough that it outpaces the research infrastructure built around it. Shopper behavior is being established in real time, category norms haven’t formed, and the data that retailers use to make decisions about those categories is thin.
\n\n
The brands that invest in original shopper research during this window—before category norms calcify—gain durable advantage. They understand how shoppers navigate uncertainty in the category before competitors do. That understanding shapes shelf strategy, associate training, and promotional investment in ways that are difficult to replicate once the category matures.
\n\n \n
From Insight to Action: Closing the Loop with In-Store Execution
\n \n\n
The final stage of a shopper insight program is also the most commonly skipped: closing the loop between what the research found and what changed in the store as a result.
\n\n
This is not an analytical problem. It is an organizational problem. Research findings often land with strategy teams. Execution happens with field teams, category managers, and store associates. The handoff between those groups is where insight most frequently gets lost.
\n\n
Building the Execution Bridge
\n\n
Research programs that are designed with execution in mind produce different deliverables than programs designed for analysis. The difference is specificity. An analysis deliverable might say: “Shoppers in the health tech department demonstrate high interest and low conversion, suggesting a need for improved associate engagement.” An execution deliverable says: “Associates in the health tech department should initiate contact within 45 seconds of a shopper picking up a product, and should lead with outcome framing rather than feature description. This change is projected to improve category conversion by 8–12% based on comparable programs in analogous categories.”
\n\n
The second version gives the field team something to do on Monday. That specificity is what separates research programs that produce ROI from those that produce reports.
\n\n
Measurement Closes the Loop
\n\n
Every execution change driven by shopper insight should have a measurement plan attached. What metric will move if the change is working? Over what time period? What is the baseline? What is the threshold for further adjustment?
\n\n
This discipline has two benefits. First, it confirms whether the insight was correct and the execution was effective. Second, it builds the organizational case for continued investment in research. Teams that can demonstrate that a mystery shopping program produced a measurable improvement in conversion or service quality will continue to receive research budgets. Teams that can only show that they conducted research will not.
\n\n
T-ROC’s Integrated Approach
\n\n
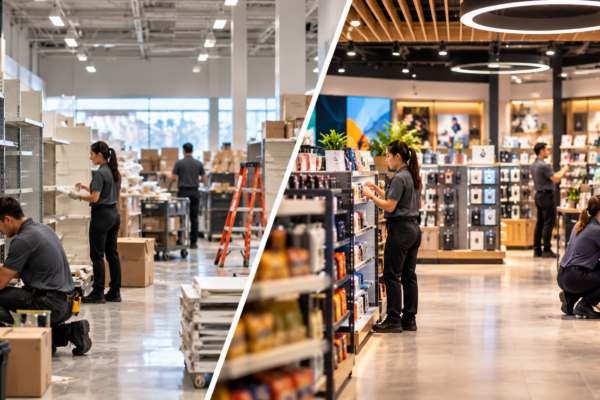
T-ROC’s Consumer Insight division operates at the intersection of research and execution. The same organization that designs and runs mystery shopping programs, observational studies, and shopper analytics also provides the field teams, associate training programs, and merchandising execution services that implement the findings. That integration eliminates the handoff problem.
\n\n
When research and execution live in separate organizations—or in separate silos within the same organization—insight degrades in transit. When they are connected by shared data and shared accountability, the loop closes faster and the ROI of research investment becomes measurable and repeatable.
\n\n \n
Frequently Asked Questions
\n \n\n
What is the difference between shopper insights and market research?
\n
Market research is a broad category that includes brand tracking, competitive analysis, category sizing, and consumer attitude studies. Shopper insights are a subset of market research focused specifically on behavior at the point of purchase. All shopper insight work is market research; not all market research produces shopper insights.
\n\n
How often should a retailer or brand conduct shopper insight research?
\n
The right cadence depends on category velocity, strategic priority, and operational change rate. Mystery shopping programs typically run on a continuous or quarterly basis to track service quality against a standard. Observational research is often project-based, tied to specific decisions such as planogram resets or store format changes. Transaction data analysis should be ongoing. The mistake is treating research as a one-time event rather than an ongoing input to operations.
\n\n
What sample size is needed for shopper insight research to be reliable?
\n
It depends on the method and the question. Mystery shopping programs measuring service quality across a store network typically require 2–4 visits per store per period to achieve statistical reliability at the individual store level. Observational studies targeting specific in-store behaviors can produce actionable findings with 50–100 observations per location, depending on variance in the behaviors being tracked. For transaction data analysis, sample size is rarely a constraint—the question is data quality and the clarity of the analytical hypothesis.
\n\n
Can shopper insights be captured in e-commerce environments?
\n
Yes, though the methods differ. Digital shopper analytics—session recording, click mapping, funnel analysis, A/B testing—capture the online equivalent of in-store behavioral data. The analytical logic is the same: what did the shopper do, where did they pause, where did they drop, what drove conversion? The specific tools are different from in-store research methods, but the strategic application of the findings is structurally identical.
\n\n
How does mystery shopping differ from customer satisfaction surveys?
\n
Customer satisfaction surveys capture stated experience after the fact. Mystery shopping captures objective assessment of defined criteria during the experience itself. Satisfaction surveys are subject to recall bias, social desirability effects, and response rate skew toward the most and least satisfied customers. Mystery shopping produces standardized, comparable data across locations and time periods. Both have uses; they answer different questions and should not be treated as substitutes for each other.
\n\n
What is the ROI of a shopper insight program?
\n
ROI varies significantly by program design and execution discipline. Programs that are designed around specific business decisions—a planogram reset, a staffing model change, a promotional strategy—and that include pre/post measurement produce the clearest ROI documentation. In T-ROC’s experience, the highest-ROI programs are those where research findings are connected directly to field execution and measured against specific conversion or compliance metrics. The return on insight is only realized when insight drives action.
\n\n \n
Build Your Shopper Insight Strategy with T-ROC
\n \n\n
Most retail brands are not suffering from a data shortage. They are suffering from a translation problem: the gap between what the data shows and what changes on the floor of the store.
\n\n
T-ROC’s Consumer Insight division—MSPA Americas Elite 2022—closes that gap. We design mystery shopping programs, observational studies, and shopper analytics programs with execution in mind from the first research question. And because T-ROC also provides the field teams and in-store execution resources to act on findings, the insight-to-action loop closes in weeks, not quarters.
\n\n
If you are making decisions about planogram strategy, associate training, promotional execution, or store format based on data you collected more than 12 months ago—or based on data you have not collected at all—you are operating on assumptions. We can tell you what is actually happening.
\n\n
Contact T-ROC to discuss a shopper insight program designed around your specific business decisions.
\n\n